- Chapter: Chapter 14 — Statistics | Class 10 Maths (NCERT)
- Exercise 14.1 Focus: Mean of Grouped Data using Direct, Assumed Mean, and Step Deviation methods
- Direct Method Formula: \( \bar{x} = \frac{\sum f_i x_i}{\sum f_i} \)
- Assumed Mean Method: \( \bar{x} = A + \frac{\sum f_i d_i}{\sum f_i} \), where \( d_i = x_i – A \)
- Step Deviation Method: \( \bar{x} = A + \frac{\sum f_i u_i}{\sum f_i} \times h \), where \( u_i = \frac{x_i – A}{h} \)
- Class Mark: \( x_i = \frac{\text{Upper limit} + \text{Lower limit}}{2} \)
- Total Questions in Ex 14.1: 9 questions — all solved below
- Board Exam Weightage: Statistics carries 6–11 marks in CBSE Class 10 board exam 2026-27
The NCERT Solutions for Class 10 Maths Chapter 14 Statistics provided here cover all 9 questions of Exercise 14.1 with complete, step-by-step working — updated for the 2026-27 CBSE board exam. You can find these solutions as part of our comprehensive NCERT Solutions for Class 10 resource hub. Whether you need the direct method, assumed mean method, or step deviation method, every solution is explained clearly so you understand why each step works — not just what the answer is. These solutions are based on the official NCERT textbook and align with the latest rationalised syllabus. For all subjects and classes, visit our NCERT Solutions main page.
Table of Contents
- Quick Revision Box
- Chapter 14 Statistics — Chapter Overview
- Key Concepts and Formulas — Mean of Grouped Data
- NCERT Solutions for Class 10 Maths Chapter 14 Statistics — Exercise 14.1
- Formula Reference Table — Statistics Class 10
- Important Questions for CBSE Board Exam
- Common Mistakes Students Make in Statistics
- Exam Tips for 2026-27 CBSE Board Exam
- Frequently Asked Questions
NCERT Solutions for Class 10 Maths Chapter 14 Statistics — Chapter Overview
Chapter 14 Statistics in the Class 10 NCERT Maths textbook (Mathematics — Textbook for Class X, published by NCERT) teaches you how to analyse and interpret data that is presented in grouped form. Exercise 14.1 focuses entirely on finding the mean of grouped data (समूहीकृत आँकड़ों का माध्य) using three different methods. This is a core skill tested in CBSE board exams every year.
The chapter builds on your knowledge of basic statistics from Class 9, where you worked with ungrouped data. Here, data is organised into class intervals with frequencies, making direct calculation harder — which is why you need systematic methods. The three methods taught are the Direct Method, the Assumed Mean Method (कल्पित माध्य विधि), and the Step Deviation Method (पग-विचलन विधि).
In CBSE board exams, Statistics typically carries 6 to 11 marks. Questions from this chapter appear as 2-mark and 3-mark problems (short answer) and occasionally as 5-mark problems (long answer). Knowing which method to choose — and showing all working — is what earns you full marks.
| Detail | Information |
|---|---|
| Chapter | Chapter 14 — Statistics |
| Textbook | Mathematics — Textbook for Class X (NCERT) |
| Class | Class 10 (Grade 10) |
| Subject | Mathematics |
| Exercise Covered | Exercise 14.1 (9 Questions) |
| Board Exam Weightage | 6–11 marks (approx.) |
| Difficulty Level | Medium |
| Academic Year | 2026-27 |
Key Concepts and Formulas — Mean of Grouped Data
Class Mark (वर्ग चिह्न)
For each class interval, the class mark \( x_i \) is the midpoint of that interval. You calculate it as:
\[ x_i = \frac{\text{Upper Class Limit} + \text{Lower Class Limit}}{2} \]
For example, for the class interval 10–20, the class mark is \( x_i = \frac{10 + 20}{2} = 15 \).
Direct Method (प्रत्यक्ष विधि)
Use the Direct Method when the class marks \( x_i \) are small numbers and calculations are manageable. The formula is:
\[ \bar{x} = \frac{\sum f_i x_i}{\sum f_i} \]
Here, \( f_i \) is the frequency of the \( i \)-th class and \( x_i \) is its class mark. You multiply each \( f_i \) by \( x_i \), sum all products, and divide by the total frequency.
Assumed Mean Method (कल्पित माध्य विधि)
When class marks are large, computing \( f_i x_i \) directly becomes tedious. Choose any convenient value \( A \) (usually the middle class mark) as the assumed mean. Then calculate deviations \( d_i = x_i – A \) and use:
\[ \bar{x} = A + \frac{\sum f_i d_i}{\sum f_i} \]
Step Deviation Method (पग-विचलन विधि)
When class sizes \( h \) are equal and deviations \( d_i \) are multiples of \( h \), divide the deviations by \( h \) to get step deviations \( u_i = \frac{x_i – A}{h} \). The formula becomes:
\[ \bar{x} = A + \frac{\sum f_i u_i}{\sum f_i} \times h \]
This method gives the simplest arithmetic, especially when all class intervals have equal width.
NCERT Solutions for Class 10 Maths Chapter 14 Statistics — Exercise 14.1 (All 9 Questions)
Question 1
Easy
A survey was conducted by a group of students as a part of their environment awareness programme, in which they collected the following data regarding the number of plants in 20 houses in a locality. Find the mean number of plants per house. Which method did you use for finding the mean, and why?
Data: Number of plants: 0–2 (freq 1), 2–4 (freq 2), 4–6 (freq 1), 6–8 (freq 5), 8–10 (freq 6), 10–12 (freq 2), 12–14 (freq 3). Total: 20 houses.
Key Concept: Since the class marks \( x_i \) are small numbers (1, 3, 5, 7, 9, 11, 13), the Direct Method is most convenient here.
Step 1: Find the class mark \( x_i \) for each interval: \( x_i = \frac{\text{lower} + \text{upper}}{2} \)
0–2 → \( x_i = 1 \); 2–4 → \( x_i = 3 \); 4–6 → \( x_i = 5 \); 6–8 → \( x_i = 7 \); 8–10 → \( x_i = 9 \); 10–12 → \( x_i = 11 \); 12–14 → \( x_i = 13 \)
Step 2: Calculate \( f_i x_i \) for each class:
| Class | \( f_i \) | \( x_i \) | \( f_i x_i \) |
|---|---|---|---|
| 0–2 | 1 | 1 | 1 |
| 2–4 | 2 | 3 | 6 |
| 4–6 | 1 | 5 | 5 |
| 6–8 | 5 | 7 | 35 |
| 8–10 | 6 | 9 | 54 |
| 10–12 | 2 | 11 | 22 |
| 12–14 | 3 | 13 | 39 |
| Total | 20 | 162 |
Step 3: Apply the Direct Method formula:
\[ \bar{x} = \frac{\sum f_i x_i}{\sum f_i} = \frac{162}{20} = 8.1 \]
Why Direct Method? The class marks are small single-digit numbers, so multiplying \( f_i \times x_i \) is straightforward. No need for the assumed mean or step deviation method.
\( \therefore \) Mean number of plants per house = 8.1
Method used: Direct Method, because the class marks (xi) are small numbers, making direct calculation simple and error-free.
Question 2
Medium
Consider the following distribution of daily wages of 50 workers of a factory. Find the mean daily wages of the workers of the factory by using an appropriate method.
Data: 100–120 (freq 12), 120–140 (freq 14), 140–160 (freq 8), 160–180 (freq 6), 180–200 (freq 10). Total: 50 workers.
Key Concept: The class marks are large (110, 130, 150, 170, 190), so the Assumed Mean Method is appropriate. Choose \( A = 150 \) (middle class mark).
Step 1: Find class marks and deviations \( d_i = x_i – A \) where \( A = 150 \):
| Class | \( f_i \) | \( x_i \) | \( d_i = x_i – 150 \) | \( f_i d_i \) |
|---|---|---|---|---|
| 100–120 | 12 | 110 | −40 | −480 |
| 120–140 | 14 | 130 | −20 | −280 |
| 140–160 | 8 | 150 | 0 | 0 |
| 160–180 | 6 | 170 | 20 | 120 |
| 180–200 | 10 | 190 | 40 | 400 |
| Total | 50 | −240 |
Step 2: Apply the Assumed Mean Method formula:
\[ \bar{x} = A + \frac{\sum f_i d_i}{\sum f_i} = 150 + \frac{-240}{50} = 150 – 4.8 = 145.20 \]
\( \therefore \) Mean daily wages = ₹ 145.20
Question 3
Medium
The following distribution shows the daily pocket allowance of children of a locality. The mean pocket allowance is ₹ 18. Find the missing frequency f.
Data: 11–13 (freq 7), 13–15 (freq 6), 15–17 (freq 9), 17–19 (freq 13), 19–21 (freq f), 21–23 (freq 5), 23–25 (freq 4). Total frequency = 44 + f. Mean = 18.
Key Concept: When the mean is given and a frequency is missing, set up the Direct Method formula, substitute the known mean, and solve for \( f \).
Step 1: Find class marks: 12, 14, 16, 18, 20, 22, 24.
Step 2: Calculate \( f_i x_i \):
| Class | \( f_i \) | \( x_i \) | \( f_i x_i \) |
|---|---|---|---|
| 11–13 | 7 | 12 | 84 |
| 13–15 | 6 | 14 | 84 |
| 15–17 | 9 | 16 | 144 |
| 17–19 | 13 | 18 | 234 |
| 19–21 | f | 20 | 20f |
| 21–23 | 5 | 22 | 110 |
| 23–25 | 4 | 24 | 96 |
| Total | 44 + f | 752 + 20f |
Step 3: Use the mean formula and substitute \( \bar{x} = 18 \):
\[ 18 = \frac{752 + 20f}{44 + f} \]
Step 4: Cross-multiply and solve:
\[ 18(44 + f) = 752 + 20f \]
\[ 792 + 18f = 752 + 20f \]
\[ 792 – 752 = 20f – 18f \]
\[ 40 = 2f \]
\[ f = 20 \]
\( \therefore \) The missing frequency f = 20
Question 4
Medium
Thirty women were examined in a hospital by a doctor and the number of heart beats per minute were recorded and summarised as follows. Find the mean heart beats per minute for these women, choosing a suitable method.
Data: 65–68 (freq 2), 68–71 (freq 4), 71–74 (freq 3), 74–77 (freq 8), 77–80 (freq 7), 80–83 (freq 4), 83–86 (freq 2). Total: 30 women.
Key Concept: The class size \( h = 3 \) is equal for all intervals and class marks are moderately large, so the Step Deviation Method is most suitable. Choose \( A = 75.5 \) (middle class mark).
Step 1: Find class marks: 66.5, 69.5, 72.5, 75.5, 78.5, 81.5, 84.5.
Step 2: Calculate step deviations \( u_i = \frac{x_i – 75.5}{3} \):
| Class | \( f_i \) | \( x_i \) | \( u_i = \frac{x_i – 75.5}{3} \) | \( f_i u_i \) |
|---|---|---|---|---|
| 65–68 | 2 | 66.5 | −3 | −6 |
| 68–71 | 4 | 69.5 | −2 | −8 |
| 71–74 | 3 | 72.5 | −1 | −3 |
| 74–77 | 8 | 75.5 | 0 | 0 |
| 77–80 | 7 | 78.5 | 1 | 7 |
| 80–83 | 4 | 81.5 | 2 | 8 |
| 83–86 | 2 | 84.5 | 3 | 6 |
| Total | 30 | 4 |
Step 3: Apply the Step Deviation Method formula:
\[ \bar{x} = A + \frac{\sum f_i u_i}{\sum f_i} \times h = 75.5 + \frac{4}{30} \times 3 = 75.5 + 0.4 = 75.9 \]
\( \therefore \) Mean heart beats per minute = 75.9
Question 5
Medium
In a retail market, fruit vendors were selling mangoes kept in packing boxes. These boxes contained varying number of mangoes. The following was the distribution of mangoes according to the number of boxes. Find the mean number of mangoes kept in a packing box. Which method of finding the mean did you choose?
Data: 50–52 (freq 15), 52–54 (freq 110), 54–56 (freq 135), 56–58 (freq 115), 58–60 (freq 25). Total: 400 boxes.
Key Concept: The class marks (51, 53, 55, 57, 59) are large and the class size \( h = 2 \) is uniform, making the Step Deviation Method most efficient. Choose \( A = 55 \).
Step 1: Calculate \( u_i = \frac{x_i – 55}{2} \):
| Class | \( f_i \) | \( x_i \) | \( u_i = \frac{x_i – 55}{2} \) | \( f_i u_i \) |
|---|---|---|---|---|
| 50–52 | 15 | 51 | −2 | −30 |
| 52–54 | 110 | 53 | −1 | −110 |
| 54–56 | 135 | 55 | 0 | 0 |
| 56–58 | 115 | 57 | 1 | 115 |
| 58–60 | 25 | 59 | 2 | 50 |
| Total | 400 | 25 |
Step 2: Apply the formula:
\[ \bar{x} = A + \frac{\sum f_i u_i}{\sum f_i} \times h = 55 + \frac{25}{400} \times 2 = 55 + 0.125 = 55.875 \approx 55.88 \]
\( \therefore \) Mean number of mangoes per box ≈ 55.875
Method used: Step Deviation Method, because the class marks are large numbers and the class size is uniform (h = 2), making step deviations simple integers.
Question 6
Medium
The table below shows the daily expenditure on food of 25 households in a locality. Find the mean daily expenditure on food by a suitable method.
Data: 100–150 (freq 4), 150–200 (freq 5), 200–250 (freq 12), 250–300 (freq 2), 300–350 (freq 2). Total: 25 households.
Key Concept: Class marks are large (125, 175, 225, 275, 325) and class size \( h = 50 \) is uniform. Use the Step Deviation Method with \( A = 225 \).
Step 1: Calculate \( u_i = \frac{x_i – 225}{50} \):
| Class | \( f_i \) | \( x_i \) | \( u_i = \frac{x_i – 225}{50} \) | \( f_i u_i \) |
|---|---|---|---|---|
| 100–150 | 4 | 125 | −2 | −8 |
| 150–200 | 5 | 175 | −1 | −5 |
| 200–250 | 12 | 225 | 0 | 0 |
| 250–300 | 2 | 275 | 1 | 2 |
| 300–350 | 2 | 325 | 2 | 4 |
| Total | 25 | −7 |
Step 2: Apply the Step Deviation Method formula:
\[ \bar{x} = A + \frac{\sum f_i u_i}{\sum f_i} \times h = 225 + \frac{-7}{25} \times 50 = 225 – 14 = 211 \]
\( \therefore \) Mean daily expenditure on food = ₹ 211
Question 7
Easy
To find out the concentration of SO₂ in the air (in parts per million, i.e. ppm), the data was collected for 30 localities in a certain city and is presented below. Find the mean concentration of SO₂ in the air.
Data: 0.00–0.04 (freq 4), 0.04–0.08 (freq 9), 0.08–0.12 (freq 9), 0.12–0.16 (freq 2), 0.16–0.20 (freq 4), 0.20–0.24 (freq 2). Total: 30 localities.
Key Concept: The class marks are small decimal values, so the Direct Method works well here.
Step 1: Find class marks: 0.02, 0.06, 0.10, 0.14, 0.18, 0.22.
Step 2: Calculate \( f_i x_i \):
| Class (ppm) | \( f_i \) | \( x_i \) | \( f_i x_i \) |
|---|---|---|---|
| 0.00–0.04 | 4 | 0.02 | 0.08 |
| 0.04–0.08 | 9 | 0.06 | 0.54 |
| 0.08–0.12 | 9 | 0.10 | 0.90 |
| 0.12–0.16 | 2 | 0.14 | 0.28 |
| 0.16–0.20 | 4 | 0.18 | 0.72 |
| 0.20–0.24 | 2 | 0.22 | 0.44 |
| Total | 30 | 2.96 |
\[ \bar{x} = \frac{\sum f_i x_i}{\sum f_i} = \frac{2.96}{30} = 0.0987 \approx 0.099 \text{ ppm} \]
\( \therefore \) Mean concentration of SO₂ = 0.099 ppm (approximately)
Question 8
Medium
A class teacher has the following absentee record of 40 students of a class for the whole term. Find the mean number of days a student was absent.
Data: 0–6 (freq 11), 6–10 (freq 10), 10–14 (freq 7), 14–20 (freq 4), 20–28 (freq 4), 28–38 (freq 3), 38–40 (freq 1). Total: 40 students.
Key Concept: The class sizes are unequal (6, 4, 4, 6, 8, 10, 2), so the Direct Method must be used. The Step Deviation Method requires equal class sizes.
Step 1: Find class marks: \( x_i \) = 3, 8, 12, 17, 24, 33, 39.
Step 2: Calculate \( f_i x_i \):
| Class | \( f_i \) | \( x_i \) | \( f_i x_i \) |
|---|---|---|---|
| 0–6 | 11 | 3 | 33 |
| 6–10 | 10 | 8 | 80 |
| 10–14 | 7 | 12 | 84 |
| 14–20 | 4 | 17 | 68 |
| 20–28 | 4 | 24 | 96 |
| 28–38 | 3 | 33 | 99 |
| 38–40 | 1 | 39 | 39 |
| Total | 40 | 499 |
\[ \bar{x} = \frac{\sum f_i x_i}{\sum f_i} = \frac{499}{40} = 12.475 \approx 12.48 \text{ days} \]
\( \therefore \) Mean number of days a student was absent ≈ 12.48 days
Question 9
Medium
The following table gives the literacy rate (in percentage) of 35 cities. Find the mean literacy rate.
Data: 45–55 (freq 3), 55–65 (freq 10), 65–75 (freq 11), 75–85 (freq 8), 85–95 (freq 3). Total: 35 cities.
Key Concept: Class marks are moderately large (50, 60, 70, 80, 90) and class size \( h = 10 \) is uniform. The Step Deviation Method is most efficient. Choose \( A = 70 \).
Step 1: Calculate \( u_i = \frac{x_i – 70}{10} \):
| Class (%) | \( f_i \) | \( x_i \) | \( u_i = \frac{x_i – 70}{10} \) | \( f_i u_i \) |
|---|---|---|---|---|
| 45–55 | 3 | 50 | −2 | −6 |
| 55–65 | 10 | 60 | −1 | −10 |
| 65–75 | 11 | 70 | 0 | 0 |
| 75–85 | 8 | 80 | 1 | 8 |
| 85–95 | 3 | 90 | 2 | 6 |
| Total | 35 | −2 |
\[ \bar{x} = A + \frac{\sum f_i u_i}{\sum f_i} \times h = 70 + \frac{-2}{35} \times 10 = 70 – \frac{20}{35} = 70 – \frac{4}{7} \approx 70 – 0.571 = 69.43\% \]
\( \therefore \) Mean literacy rate ≈ 69.43%
Formula Reference Table — Statistics Class 10
| Formula Name | Formula | Variables Defined | When to Use |
|---|---|---|---|
| Class Mark | \( x_i = \frac{\text{Lower} + \text{Upper}}{2} \) | Midpoint of class interval | Always — first step |
| Direct Method | \( \bar{x} = \frac{\sum f_i x_i}{\sum f_i} \) | \( f_i \) = frequency, \( x_i \) = class mark | Small class marks or unequal class sizes |
| Assumed Mean Method | \( \bar{x} = A + \frac{\sum f_i d_i}{\sum f_i} \) | \( A \) = assumed mean, \( d_i = x_i – A \) | Large class marks, equal or unequal class sizes |
| Step Deviation Method | \( \bar{x} = A + \frac{\sum f_i u_i}{\sum f_i} \times h \) | \( u_i = \frac{x_i – A}{h} \), \( h \) = class size | Large class marks AND equal class sizes |
| Empirical Relation | \( 3 \times \text{Median} = \text{Mode} + 2 \times \text{Mean} \) | Connects all three measures of central tendency | When one measure is unknown |
Important Questions for CBSE Board Exam — Statistics Class 10
1-Mark Questions
- Q: What is the class mark of the interval 20–30? A: \( x_i = \frac{20+30}{2} = 25 \)
- Q: Write the formula for mean using the Step Deviation Method. A: \( \bar{x} = A + \frac{\sum f_i u_i}{\sum f_i} \times h \)
- Q: State the empirical relationship between mean, median, and mode. A: \( 3 \times \text{Median} = \text{Mode} + 2 \times \text{Mean} \)
3-Mark Questions
Q: The mean of the following frequency distribution is 62.8 and the sum of all frequencies is 50. Find the missing frequencies f₁ and f₂.
Approach: Set up two equations — one from \( \sum f_i = 50 \) and one from the mean formula. Solve the simultaneous equations. Always show both equations clearly.
Q: Find the mean of the following data using the Assumed Mean Method: 0–10 (5), 10–20 (10), 20–30 (25), 30–40 (30), 40–50 (10).
Approach: Choose \( A = 25 \), calculate \( d_i \), find \( \sum f_i d_i = -200 \), \( \sum f_i = 80 \). Mean \( = 25 + \frac{-200}{80} = 25 – 2.5 = 22.5 \).
5-Mark Question
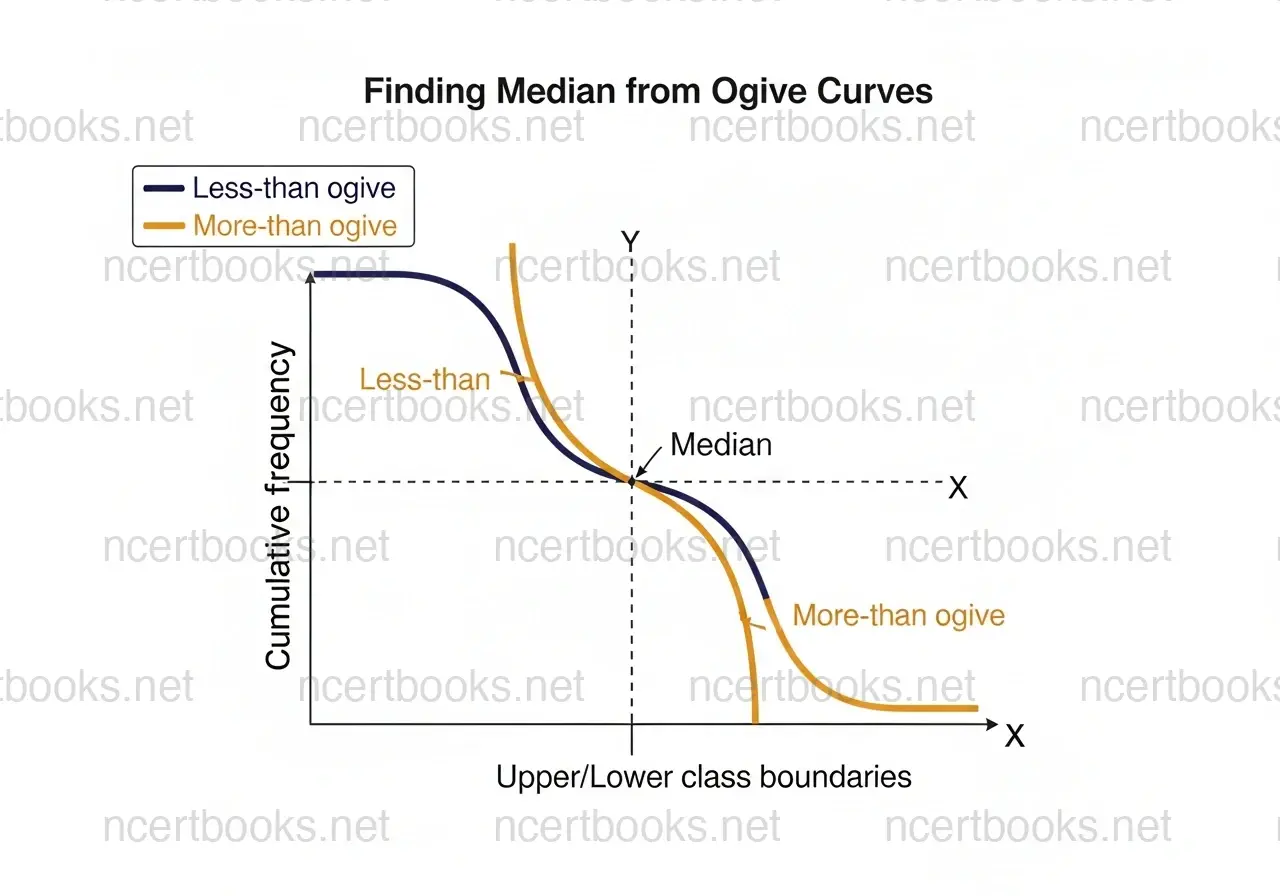
Q: The following distribution gives the daily income of 50 workers of a factory. Convert the distribution to a less-than ogive and find the median graphically.
Approach: First find cumulative frequencies. Plot points (upper class limit, cumulative frequency). Draw a smooth curve. Locate \( \frac{n}{2} = 25 \) on the y-axis, draw a horizontal line to the curve, then drop a vertical to the x-axis — that value is the median. This type of question is worth full marks if the graph is neat and correctly labelled.
Common Mistakes Students Make in Statistics Class 10
Mistake 1: Using the class limit instead of the class mark in the formula.
Why it’s wrong: The formula \( \bar{x} = \frac{\sum f_i x_i}{\sum f_i} \) requires the midpoint \( x_i \) of each class, not the lower or upper boundary.
Correct approach: Always compute \( x_i = \frac{\text{Lower} + \text{Upper}}{2} \) first before filling the table.
Mistake 2: Using the Step Deviation Method when class sizes are unequal.
Why it’s wrong: The step deviation \( u_i = \frac{x_i – A}{h} \) only gives integers when \( h \) is uniform. Unequal class sizes produce messy fractions and wrong answers.
Correct approach: For unequal class sizes (like Question 8), always use the Direct Method.
Mistake 3: Forgetting the negative sign in \( \sum f_i d_i \) or \( \sum f_i u_i \).
Why it’s wrong: If the assumed mean is above most class marks, the sum will be negative. Dropping the sign gives a wrong (inflated) mean.
Correct approach: Keep a separate column for signs. Add positive and negative \( f_i d_i \) values separately, then subtract.
Mistake 4: Not justifying the method chosen when the question asks for it.
Why it’s wrong: Questions 1 and 5 explicitly ask “which method did you use and why?” — skipping this costs you 1 mark.
Correct approach: Write one sentence: e.g., “I used the Direct Method because the class marks are small numbers, making direct multiplication simple.”
Mistake 5: Rounding intermediate values instead of only the final answer.
Why it’s wrong: Rounding \( f_i x_i \) values mid-calculation introduces cumulative error and changes the final answer.
Correct approach: Carry all decimal places through the calculation and round only the final mean value to 2 decimal places.
Exam Tips for 2026-27 CBSE Board Exam — Statistics Chapter 14
- Method Justification: Whenever a question says “choose a suitable method” or “which method did you use?”, always write a one-line reason. The CBSE marking scheme awards 1 mark for this justification.
- Show All Steps: Even if you can solve the problem mentally, write every step — \( x_i \) calculation, the full table, \( \sum f_i x_i \), and the final formula. Step-by-step working is mandatory for 2-3 mark questions.
- Table Format: Draw a neat frequency distribution table with clearly labelled columns (\( f_i \), \( x_i \), \( d_i \) or \( u_i \), \( f_i x_i \) etc.). Examiners follow the table row by row — a messy table loses marks.
- Check \( \sum f_i \): Always verify that your sum of frequencies equals the total given in the question (e.g., 50 workers, 30 women). A mismatch means a calculation error.
- Missing Frequency Questions: Set up the mean equation first, substitute the given mean, and solve algebraically. This type appears frequently in board papers and is fully solvable if you follow the method correctly.
- Weightage: Statistics carries approximately 6–11 marks in the CBSE Class 10 Maths board exam 2026-27. Mastering Exercise 14.1 (mean) and Exercise 14.2 (mode) and Exercise 14.3 (median) gives you a reliable scoring block.
For more solved exercises from Class 10 Maths, check our NCERT Solutions for Class 10 hub, which covers all 15 chapters with step-by-step answers.